TABLE OF CONTENTS
Summary
Introduction
Methods
Results
THP cell lines
3T3 cell lines
B16 cell lines
Rafi cell lines
Discussion and frequency model
Discussion, Part 1
THP cell lines
3T3 cell lines
B16 cell lines
Rafi cell lines
Reproducibility
The cooperativity effect
of the frequencies
Prototype and series instrument
of F-SCAN 2
Regarding the signal characteristics
of the individual frequencies
Discussion, Part 2
Are the described EMF effects
due to mutations?
Model for the cellular effects
by EMF treatment
Appendix
Literature
Abbreviations
Author
Low-energy electromagnetic frequencies induce
conspicuous, reproducible, and lasting effects in human
and animal cells
RESULTS
Which cellular effects could be expected by the frequency treatments? A representative parameter for the whole cellular activity was sought. Growth is a good candidate because it can be assumed that it is affected by most metabolic functions and vice versa. In addition, attention was paid to the emergence of new or modified structures or properties of the cells. And there were some: aggregation into larger clusters for THP-J cells, more adherent cells for THP-J, more giant cells for 3T3-K, and more dendrites for 3T3-J and 3T3-K.
THP cell lines
THP-1 monocytes grow in suspension as individual cells or in small groups. After EMF treatment with the frequencies A+C, some of the THP-J cells aggregated into clusters comprising 100 or more cells instead of the usual 2–15, maximal 40 cells (see Table 1 and Figure 1). Most groups formed in the middle of a culture flask. The clusters were present under all cultivation conditions. The extent of aggregation varied depending on the age of the cell culture and on the type and amount of serum.
Growth analyses showed that the THP-1 cells proliferate almost twice as fast as THP-J in FBS (Figure 2). Differential changes in the growth of these cell lines occurred depending on the type and amount of serum and on other variables, such as number of cells used to initiate a culture and frequency of medium exchange. A low cell count at the start of the experiments was decisive for a significant difference in growth (200% and more). THP-1 cultures starting with 50,000 or less cells per ml nutrient solution grew well in the presence of 10% FBS, but very little in the first 20 days in a medium containing 7.5% or 15% NBS. In contrast, THP-J cultures initiated with 50,000 or less cells per ml nutrient solution proliferated well in all 3 media right from the start. If the concentration of cells was increased to 100,000 cells per ml at initiation of growth, the differences between THP-1/J disappeared.
It was not possible to repeat these specific growth properties 4 years later with the identical cell lines: all THP-1 and THP-J cultures started at low cell concentration died after a few weeks.
An examination of the THP-1/J cells after staining with the vital stain CFSE for laser cell analysis of individual cells showed a differential growth pattern: a small fraction of the THP-J cells, about 20%, divided more rapidly than the other THP-J cells and 99.5% of the THP-1 cells. In contrast, 80% of the THP-J grew more slowly than the THP-1 cells. The adherent cells, a small fraction of THP-1 and THP-J, are not included in these numbers. The fraction of apoptotic cells in both cell lines was comparable. Both cell lines were started for the CSFE experiment with more than 100,000 cells pro ml medium.
THP-1 monocytes, stimulated by the phorbol ester PMA, differentiate into adherent macrophages. All THP-1 and THP-J transformed into macrophages with PMA. THP-J spontaneously formed more adherent cells (macrophages) than THP-1, even without the addition of PMA (see Table 1): THP-J spontaneously formed up to 20% adherent cells, THP-1 less than 10%. Specific staining of alpha-tubulin showed a different pattern for the two cell lines: after stimulation with PMA, the THP-J cells were stained much more intensively, as compared to THP-1 or non-stimulated THP-J.
The THP cell lines were adapted to grow in NBS instead of FBS. Subsequently, at long and irregular intervals, some apoptoses occurred in the THP-1 and THP-J cultures. In the case of THP, this adaptation from FBS to NBS was performed in the first 3 months after EMF treatment, while this was done before EMF treatment for all other cell lines (3T3-L1, B16-F1, and Rafi).
Storage of THP-J in liquid nitrogen at -180°C did not have any effect on the new phenotype.
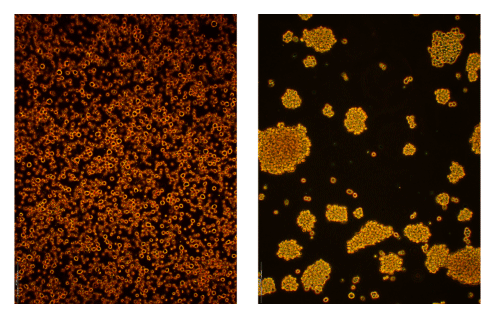
Figure 1
Typical appearance of densely grown THP-1 (left) and THP-J (right) cell cultures.
A parallel reduction in the viability of THP-1 and THP-J may have occurred; however, it only became apparent after cultivation these cell lines for more than 3 years.
Table 1 |
|||
| THP-1 | THP-J | ||
a) |
Medium containing 4% NBS | ||
| Number of individual cells, in % | 40–80 | 40–50 | |
| Number of cells per group | 4–8 | 6–25 | |
| Adherent cells in % | 3 | 8–20 | |
b) |
Medium containing 10% NBS | ||
| Number of individual cells, in % | 40–50 | 30–40 | |
| Number of cells per group | 40 | 100 | |
| Adherent cells in % | 3–4 | 8–9 | |
c) |
Medium containing 10% FBS | ||
| Number of individual cells, in % | 5–6 | 6–7 | |
| Number of cells per group | 7–15 | 50–110 | |
| Adherent cells in % | 5–6 | 8–10 | |
Table 1:
Mean values for the growth pattern of THP-1 and THP-J cells ten days after starting the cultures.
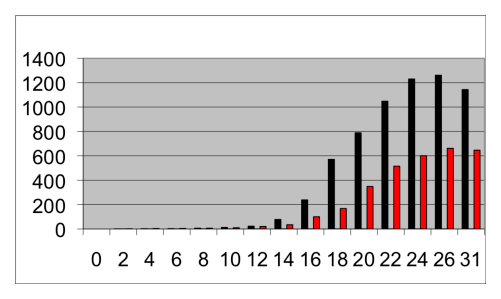
Figure 2:
Characteristic growth curves of THP-1 (black) and THP-J2 (red) over a period of 31 days. The bars show the number of cells per 10-3 ml culture in the nutrient solution containing 10% FBS. Both cultures were started with 40,000 cells per ml.
3T3 Cell lines
In contrast to THP, the 3T3, B16, and Rafi cells grow as adherent cells. The notable feature of 3T3-J and 3T3-K was the higher cell count at confluency as compared to 3T3-L1 (Figure 3). A microscopic examination showed that the 3T3-J/K cells had formed multilayers. 3T3-L1 also showed growth of cells on top of each other, but to a much lesser extent. Stronger magnification revealed that the 3T3-J and 3T3-K cells formed two to three times as many dendritic cell processes as the 3T3-L1 cells. Owing to the many dendrites, the treated cell lines had a characteristic appearance under the microscope and could easily be distinguished from 3T3-L1.
The high cell density of 3T3-K2 at confluency decreased a few days after and dropped back to the level of the control cells or even below if the medium was not replaced. This was not the case with the 3T3-J1, 3T3-J2, and 3T3-K1 cultures: they retained their high density for several days even if the growth media were not renewed. 3T3-L1, 3T3-J, and 3T3-K cells did not differ regarding their initial growth rate.
Depending on the growth conditions, the cell count at confluency for 3T3-J1/2 and 3T3-K1/2 was 160 percent and more compared to that of 3T3-L1. These values remained reproducible over the analysis period of more than 4 years.
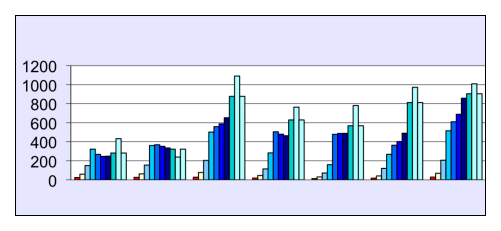
Figure 3:
Growth curves of 3T3-L1 (2x), 3T3-J1, 3T3-J2 (2x), 3T3-K1, and 3T3-K2 cells (from left to right, respectively) in a nutrient solution containing 10% NBS. The height of the bar corresponds to the number of cells per well (1/1000) determined on day 4,5,6,7,9,11,13,19,23, and 27 after starting culture at 150 cells per well in 24-well plates (shown values are means from 3 wells).
3T3-K1/2 exhibited a large number of giant cells containing many nuclei. 3T3-L1/J also produced giant cells, but they were only slightly enlarged and rare with around 0.3% of all cells. In the case of 3T3-K, up to 2% of the cells were multinucleate, and cells with 8 to 12 nuclei were often observed. This did not occur with 3T3-L1/J, whose large cells generally contained only 2–3 nuclei. The number of nuclei in the giant cells corresponded to their cell size. Giant cells already formed a few days after starting a new culture, and were not a feature of an advanced or overaged culture. The giant cells, like all other 3T3 cells, were easily detached from the bottom of the culture flask. In EDTA solution, they formed large round cells that were conspicuous and stable.
3T3-K cells had a slightly changed appearance compared to 3T3-L1 or 3T3-J: they were somewhat flattened and similar to cells that are on the verge of converting to fat cells. However, induction of 3T3-L1, -J, or -K into fat cells was not successful, possibly due to the culturing condition with NBS.
There were also differences in the cell survival rates. In this test, the 3T3-J cells showed a significant statistical difference compared to 3T3-L1 and 3T3-K, and had a clearly superior survival rate by a factor of 2.
Growth of 3T3 cell lines under metabolic stress was extensively investigated in 2008 (for culturing conditions, see the section on Rafi cells). No differential growth changes were observed in assays performed in microtiter plates.
B16 cell lines
The growth properties of the B16-J cells were changed by EMF treatment with A frequencies without C. The cells in 5 of 7 experiments grew slightly faster than the control cells, as measured by the methylene staining assay. The frequency-related change in growth was maintained as measured over 2 years. EMF treatment of the B16-F1 with B frequencies was not carried out.
The survival rate of the B16 cells was inconsistent.
B16-F1 cells synthesize melanin if they are stimulated by alpha-MSH. It was investigated whether the sensitivity of B16-F1 for alpha-MSH is changed by EMF treatment. The melanin test, which was developed by the research group of Prof. A. Eberle and which was used in the laboratory while this work was carried out, is extremely sensitive, precise, and well standardized. Three parallel batches of cells are grown for a few days in a microtiter plate before adding different amounts of alpha-MSH to stimulate synthesis of melanin, which is then measured. This test is a measure for the sensitivity of the cells to synthesize melanin by different concentrations of alpha-MSH.
New EMF treatments were carried out with B16-F1 cells in order to investigate a larger number of independently generated cell lines by the melanin test. Six cultures were treated in parallel with EMF A in a metal enclosure that shielded them from external EM fields during EMF treatment. In addition, six cultures were treated with the same EMF without shielding, and a third group of six cultures were not treated and used as controls. After EMF treatment, all cultures were cultured separately. The shielding enclosures CFL4 were from Perancea (London). Melanin synthesis by all cell lines was investigated after 11 and 32 EMF treatments of the cells. The results of the melanin synthesis showed minor differences that did not correlate with EMF treatment nor with the presence of shielding enclosures nor with the number of treatments. Furthermore, no significant differences in growth were found. Thus, the weak initial results of B16-F1/J cells could not be reproduced.
Rafi cell lines
THP-1, 3T3-L1, and B16-F1 are cell lines originally established from cancerous tissues. The question was open whether changes due to EMF treatments can also be obtained for primary, non-mutated cells. Experiments with primary lens fibroblasts (porcine) were initially carried out using a cell line obtained from Kerstin Wunderlich. Since these cells stopped growing after a few passages and died by apoptosis, growth analyses after EMF treatment were not possible. Primary rat fibroblasts on the other hand can be cultivated for a long time without genetic changes (Lit. 5,22). A culture of primary rat fibroblasts (Rafi) was established in February 2007 from a one-day-old laboratory rat. Treatments with frequency groups A (without C) or B were carried out after passage 25 in June to August 2007, and growth analyses were started 6 passages afterwards.
The first analyses did not show any differential growth behavior of the cells. It was observed however, that the number of viable cells in new cultures greatly varied from day-to-day. Only after this fluctuation was taken into account in the establishment of growth assays was it possible to document differential growth (Table 2). The procedure was as follows: the number of viable cells in a culture was determined by measuring seeding efficiency (SE) prior to the growth test. Taking the number of viable cells into account gave reproducible values for the growth assays with a variation of +/- 2% between growth cultures prepared in parallel.
Daily SE of Rafi cells showed extremely large daily variations with values ranging between 13 and 98%. The daily fluctuations of SE were low in 3T3-L1 and B16-F1 cell lines. SE of 3T3 and B16 cell lines had mean values of 80 to more than 95%, which was significantly higher than that of Rafi with 55–60%. The mean SE values were similar for Rafi-J, Rafi-K or untreated Rafi cells.
All the sterile plastic materials and the various nutrient solutions used in the work were excluded as a possible cause of the daily fluctuations of SE. It was not possible to discover its likely cause. Test series in which SE was determined regularly over a period of several months indicate the presence of different rhythms in the cells (results not shown).
It was investigated whether suboptimal compositions of the nutrient solutions increased differential growth of the Rafi cell lines. Various nutrient solutions were tested: a) hypotonic nutrient solutions, b) serum-free or low-serum media, c) nutrient solutions containing mixtures of FBS and NBS, and d) a hypertonic nutrient solution containing EGTA and ammonium phosphate. The cells grew at various rates in the different nutrient solutions. 20% of the medium had to be replaced every five days.
The growth experiments in the presence or absence of metabolic stress were carried out for all Rafi cell lines, four to six times in 96-well plates, and growth determined by the methylene assay. The results are based on triplicate experiments (Table 2). In a rich culture medium containing 5% NBS and 1.5% FBS, the growth of all cell lines was comparable. In a nutrient solution containing 30% or 42.5% water, the control cells and Rafi-K grew faster than Rafi-J. In the artificial serum-free medium, the Rafi-K cells grew more slowly. And finally, the controls grew somewhat faster than the Rafi-J/K cells in media containing 5% NBS and significantly faster in media with 1.5% FBS. The significant differences amounted to maximally 20 to 30% growth difference. The growth experiments in hypertonic nutrient solutions could not be evaluated since, in spite of the added calcium and fixation with formaldehyde, the cells detached from the bottom of the culture plates and were washed away in the staining procedure.